Maximum Demand Monitoring in Malaysia | APM521 & Acrel IoT EMS
Maximum Demand Monitoring for Malaysian Commercial and Industrial Facilities
Measure the 30-minute demand, record when the monthly maximum occurs and review the daily load curve during Malaysia’s TOU peak period.
A TNB bill shows the recorded Maximum Demand, but the bill alone does not tell the facility team which operating event created it. A demand-monitoring system fills that gap by recording the 30-minute demand, the time of the monthly maximum and the daily trend behind the result.
First, understand what TNB is measuring
TNB records Maximum Demand (MD) in kilowatts. Its published definition is twice the largest number of kilowatt-hours supplied during any consecutive 30 minutes in the month. Put simply, TNB is not looking only at a momentary spike on a meter display. It is the highest half-hour demand interval that matters.
If a facility uses 450 kWh during its highest 30-minute interval, the corresponding demand is 900 kW. Monthly kWh tells the plant manager how much electricity was consumed. MD shows how much load was placed on the supply system during the busiest interval. The two figures answer different questions.
The time of the peak matters
Under the current Time-of-Use (TOU) schedule for Peninsular Malaysia, effective from 1 July 2025, the Peak Period is 2:00 pm to 10:00 pm, Monday to Friday. The weekday period from 10:00 pm to 2:00 pm the following day, together with the whole of Saturday and Sunday, is Off-Peak.
| Day | Peak Period | Off-Peak Period |
|---|---|---|
| Monday–Friday | 2:00 pm–10:00 pm | 10:00 pm–2:00 pm the following day |
| Saturday–Sunday | None | All day |
For a non-domestic medium- or high-voltage customer billed under a TOU category, the relevant Maximum Demand for capacity and network charges is the highest 30-minute demand recorded during the Peak Period. A high load at 11:00 am and the same load at 3:00 pm therefore do not have the same MD cost implication under TOU.
Why Maximum Demand needs to be monitored
On a real site, the peak is rarely caused by one machine alone. For a Malaysian TOU customer, the period after 2:00 pm deserves particular attention. Production may already be at full output while chillers and ventilation systems are carrying the afternoon cooling load. If another compressor, oven, pump or production line starts in that same half-hour, it may establish the billable MD for the month.
Without a recorded curve and timestamp, the facility team may know that the MD was high but still be unable to identify the cause. Monitoring turns a monthly billing figure into operational evidence that can be checked against production and equipment records.
What a useful monitoring system should show
Start at the incoming supply
The safer starting point is a load study. Check the monthly MD trend, the time each peak occurred, the production shift and the equipment operating at that time. The main incomer shows the total demand, but it does not explain the cause. Sub-metering on production feeders, chillers, compressors, pumps or refrigeration circuits makes the discussion much more useful.
Record the value and the time together
A maximum-demand value is much more useful when it includes a timestamp. The facility team can match the time against production records, shift changes, equipment start-up or an HVAC schedule. A configurable demand alarm can also notify operators when the monitored value approaches an internal threshold.
Add branch meters where the total is not enough
| Monitoring point | What it shows | Why it is useful |
|---|---|---|
| Main incomer | Total site demand | Provides the customer-side reference for comparison with the TNB MD. |
| Transformer or main distribution board | Demand by building, process area or supply section | Narrows down which part of the facility created the peak. |
| Production feeder | Demand from a line or major process | Links the demand curve with production schedules and start-up events. |
| Utility feeder | Chillers, compressors, pumps or refrigeration load | Shows whether auxiliary equipment overlapped with production during the peak period. |
From monitoring data to a reduction opportunity
Suppose a TOU customer’s bill shows 1,200 kW MD during the 2:00 pm–10:00 pm Peak Period. The load study finds that a 150 kW auxiliary load can be moved before 2:00 pm, after 10:00 pm or staggered so that it does not overlap with the afternoon production peak. The working target would be 1,050 kW.
The calculation shows why the data is worth collecting; it is not a guaranteed saving. First use the demand report to confirm whether the same 150 kW overlap repeats and which equipment contributes to it. Only then should the site evaluate scheduling, alarms or a separate control project using the actual TNB tariff and operating constraints.
Acrel Maximum Demand monitoring architecture
Acrel provides the field meter and reporting platform needed to see the incoming demand, trace contributing feeders and retain the records for review. The core scope here is monitoring: APM521 calculates demand at the electrical point, while the IoT EMS Platform centralises the monthly report and daily curve.
APM521 for 30-minute Maximum Demand monitoring
The Acrel APM521 multifunction power meter can be installed at the incoming feeder or another agreed monitoring point. It measures real-time demand and records monthly maximum demand with a timestamp for active, reactive and apparent power. The meter also supports demand alarms and Modbus communication, allowing the demand value to be brought into an energy-management platform or the site’s PLC/BMS.
For the comparison to be meaningful, the CT ratio, wiring, meter clock, demand period, sliding-window width, reset date and monitoring point must be commissioned correctly. The APM521 is a customer-side monitoring meter in this application; it does not replace TNB’s revenue meter, and its recorded value should not be presented as the official billing value. During commissioning, compare both readings over several billing intervals and investigate any consistent difference.
Demand reports in the Acrel IoT EMS Platform
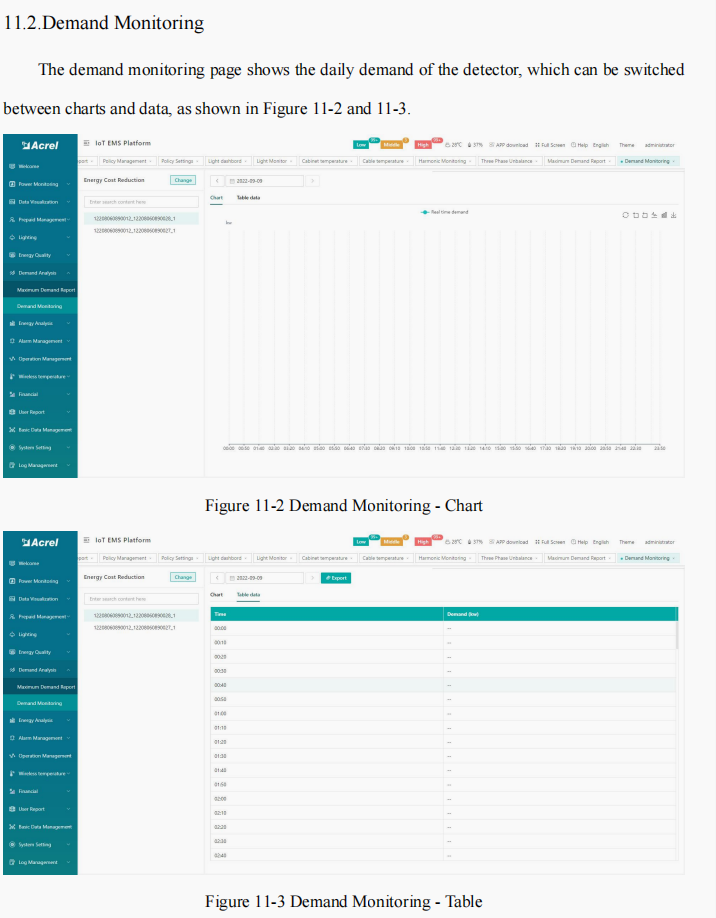
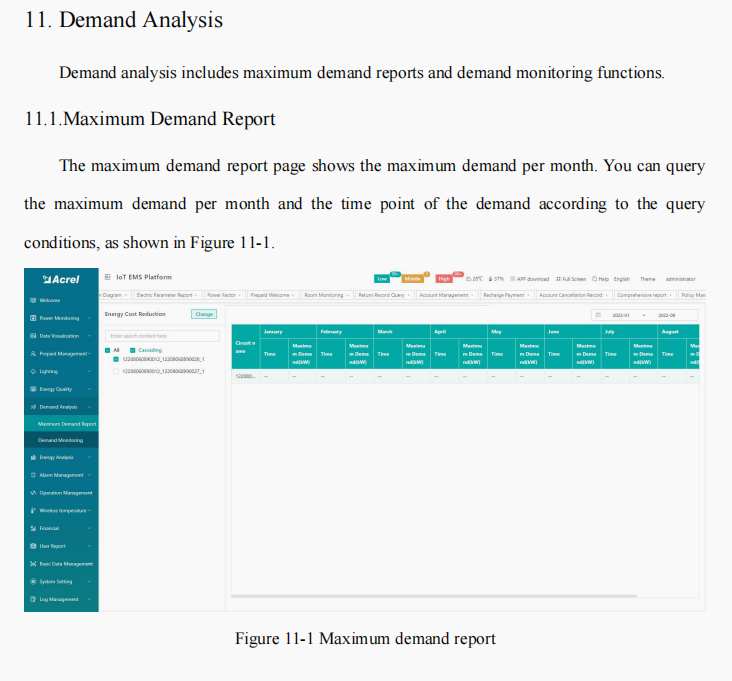
For a single incoming meter, the operator can check demand locally or through communication. When a factory has several incomers, transformers or important feeders, the Acrel IoT EMS Platform brings the records into one place. Its Demand Analysis module provides two practical views:
- Maximum Demand Report: queries the maximum demand for each month and shows the time at which it occurred. The facility team can compare different months and trace a peak back to the relevant shift or operating event.
- Demand Monitoring: shows the selected meter’s demand throughout the day. Users can switch between a trend chart and tabular data, select the date and circuit, and export the records for further review.
For a Malaysian TOU customer, the daily view helps the engineer focus on the 2:00 pm–10:00 pm Peak Period. If the monthly report shows that MD occurred at 3:40 pm, the engineer can open that day’s curve, check which feeders increased at the same time and discuss a specific operating change with production. This is more useful than waiting for the next bill and trying to reconstruct the event from memory.
Acrel IoT EMS Platform — monthly Maximum Demand Report and occurrence time
| Layer | Typical function | Engineering purpose |
|---|---|---|
| Incoming measurement | APM521 multifunction power meter, configured for a 30-minute demand period | Track real-time and monthly maximum demand, timestamp the peak and generate a demand alarm. |
| Branch measurement | Suitable multi-function or multi-circuit meters | Identify which production or utility feeders contribute to the incoming peak. |
| Communication | RS-485/Modbus and gateway options, where applicable | Collect data from dispersed switchboards and interface with the site network. |
| Energy management | Acrel IoT EMS Platform or a project-specific monitoring platform | Query monthly MD and occurrence time; review daily demand by chart or table; export records for analysis. |
| Optional alarm interface | Digital output or integration with PLC/BMS, where required | Pass a demand alarm to the site system; automatic control is a separate engineering scope. |
Product selection and automatic control require a project review. Communication availability, I/O capacity and protocol support vary by device and configuration. Protective functions and process interlocks must remain independent of energy-cost optimisation.
Information needed for a monitoring proposal
- Recent 12-month electricity bills, including tariff category and recorded MD;
- Single-line diagram, supply voltage, transformer ratings and CT ratios;
- 30-minute or higher-resolution load data, if available;
- List of incomers, transformers and major feeders that need to be monitored;
- Required reporting interval, users, alarm thresholds and data-retention period;
- Existing meters, PLC, BMS/SCADA and required communication protocols;
- Whether solar PV, generators or battery storage are already connected.
Frequently asked questions
Does lowering monthly kWh automatically reduce MD?
No. A site can reduce total energy but retain the same peak if major loads still overlap within one 30-minute interval. Energy efficiency and demand management are related but distinct tasks.
Does a high demand reading outside 2:00 pm–10:00 pm count as TOU Peak MD?
For an applicable TNB TOU account, MD-related capacity and network charges are based on Maximum Demand during the Peak Period. Demand outside that period still matters for equipment loading, energy consumption and site operation, but it is not the Peak-Period MD used for those TOU demand charges. Confirm this against the exact tariff shown on the customer’s bill.
Does demand monitoring automatically control equipment?
No. The basic scope measures, records, displays and reports demand. Alarm outputs or PLC/BMS integration can be considered separately. Automatic equipment control requires an approved load list, process interlocks and a project-specific design.
Will the APM521 reading be exactly the same as the TNB bill?
It can be configured to follow the same 30-minute demand principle, but an exact match should not be assumed. Differences in the metering point, CT accuracy and ratio, clock alignment, demand-window settings, losses and billing-meter configuration can produce different readings. Use APM521 for customer-side monitoring and control, and use the TNB meter and bill as the official billing reference.
What can the IoT EMS demand report tell the facility team?
It shows when the monthly maximum occurred and how demand changed through a selected day. This helps the team find recurring peak periods and verify whether an operating adjustment reduced site demand. It does not calculate a guaranteed bill saving by itself; the report must be interpreted together with the applicable TNB tariff and bill.
Make the monthly MD traceable
The purpose of Maximum Demand monitoring is simple: when the next bill shows a high MD value, the facility team should be able to identify the date, time and contributing load instead of guessing. APM521 provides the demand measurement at the electrical point, while the Acrel IoT EMS Platform turns those readings into monthly reports and daily curves that engineers can review and export.
References
- Tenaga Nasional Berhad — Maximum Demand
- Tenaga Nasional Berhad — Tariff Booklet
- Tenaga Nasional Berhad — Charges & Penalties
- Suruhanjaya Tenaga — RP4 tariff structure and revised Peak/Off-Peak periods
- Acrel — APM521 multifunction power meter
Need to monitor Maximum Demand at a Malaysian site?
Send us the tariff category, latest TNB bill, single-line diagram, CT ratios and the circuits to be monitored. We can prepare an APM521 and IoT EMS monitoring architecture for the project team to review.
Post time: Aug-13-2026